Hugging Face hosts over 2.5 million large language models (LLM) as of February 2026. However, identifying a subset relevant to specific use cases remains difficult, particularly in multilingual, industry-specific settings. At datAcxion, we encountered this challenge when developing an outbound voice-AI sales agent for a Turkish bank. While we faced various hurdles regarding voice activity detection (VAD), automatic speech recognition (ASR) in Turkish, user intent classification and next best action decisioning, text-to-voice (TTV) streaming, and doing all this under a sub-second latency requirement, this write-up focuses specifically on model selection.
Finding a proven LLM specifically trained for Turkish is challenging. While multilingual models exist, those augmented for Turkish banking often underperform. For instance, even models utilizing RAG or fine-tuning with Turkish banking documents, such as the Commensis LLM, did not meet our requirements.
We tested 36 Turkish-capable LLMs using product-specific prompt engineering in LM Studio on a Mac Studio M3 Ultra (512 GB uRAM). Our evaluation was based on three primary constraints:
Latency: A bank-mandated SLA of at most 3 seconds per response (demo achieved 1.1s).
Deployability: Necessary for on-premise deployment to meet the Turkish GDPR requirements.
Accuracy: A goal of handling 90% of cases without referral to a live agent.
To rank these models, we used the following scorecard:
Deployability: Decile ranking (1-10) based on model size in billions of parameters (inverse; higher is better).
Efficiency/Scale: Decile ranking (1-10) of tokens per second per billion parameters.
Latency: Decile ranking (1-10) of total elapsed time, including thinking time, time to first token, and output time (inverse; higher is better).
Semantic Quality/Language Accuracy: Decile ranking (1-10) based on output volume in terms of the number of distinct rows, linguistic quality (e.g., lack of typos or non-Turkish words), and alignment with internal taxonomy.
In our weighting, deployability and efficiency each carry a weight of 1. Deployability may be adjusted based on specific platform constraints — potentially lower for cloud operations or higher for more constrained environments. Rapid processing is essential to assess user intent and output tokens within our required SLA. While speed is important, we have demoted the latency metric’s individual weight. Smaller, non-reasoning models are naturally faster, but they often produce lower-quality results. We wanted to ensure we are not inadvertently rewarding poor output simply because it is delivered quickly. Linguistic and semantic quality/accuracy was our most critical internal priority. Inaccurate or incoherent responses negatively impact the user experience, increase referral rates to live sales agents, and can ultimately damage the brand perception. The results of our evaluation are detailed in the table below:
Before this evaluation we were using Gemma-3-27B-IT. Following the evaluation, we switched to Qwen3-30B-A3B-Thinking-2507-Claude-4.5-Sonnet-High-Reasoning-Distil. For offline demos on a laptop or in hardware constrained environments, we recommend using Turkish-Gemma-9B-T1. In terms of the model family for this particular application, Gemma ranked at the top followed by GPT-OSS. Though widely used in Turkish language applications, Qwen and Llama family of models depicted only average performance.
Note:
9 out of 36 models have been eliminated from the list as they did not produce output or produced inconsistent output across consecutive runs.
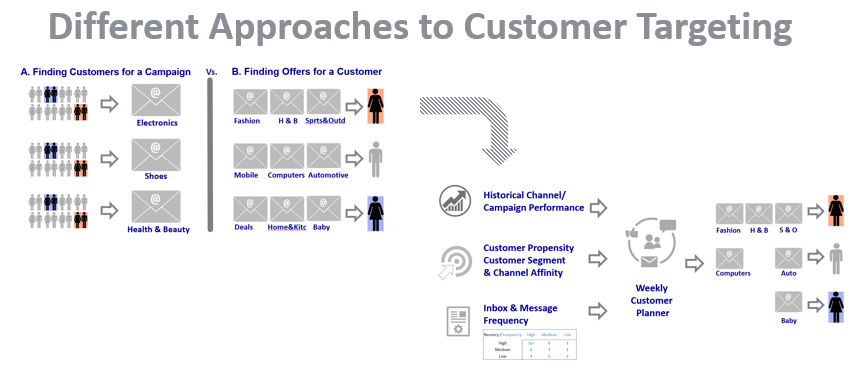
Customers engage with businesses online and offline to fulfill their needs and wants. As they do so, they leave clues about these demands in terms of items searched, reviews read, ads clicked, pages viewed or goods purchased. In turn, the marketers leverage this information to retarget these customers. Although this is a fine method of targeting – aka behavioral targeting or BT, there are several issues with this approach.
First, these are actual behaviors; as such they are limited in volume to scale to today’s marketing campaign needs. Second, by the time the marketers reach these users or customers, it is highly probable that the need/want behind these customer actions online and offline has already been fulfilled. This reach gap makes the message/offer untimely and irrelevant to the customer/user. Finally, even when all appears under control, the offer may still be the wrong one for the customer.
Most marketers today pick out customers for their campaigns as they are organized by product lines or categories (product-centric approach) rather than picking the most relevant campaign/ offer to the customer (the customer-first approach). The revenue pressures from the product categories also contributes to this issue. It is not uncommon for the category that makes the lion’s share of the revenue to bully their way onto the largest campaign audience available for targeting.
When marketing/ sales campaigns are set to maximize revenue or profitability – rather than the relevance of the offer/ message to the customer, the customer needs are not served. If your business goal this period dictates promoting more electronics to boost the revenues, this is irrelevant to most customers, e.g., Jenny and John might be up for shoes and gardening supplies, instead.
In a Customer-first undertaking, relevance replaces revenue and all functional areas of the business (management, finance, production/ product, procurement, supply-chain, logistics, finance, sales/ marketing, customer service…) are aligned with and work backwards from the customer. The enabler here is the business analytics/ machine learning optimized to the customer need/ want as opposed to the business goals of maximizing revenue or profitability.
When a business relentlessly pursues the Working-backwards strategies – proactively assessing its customers’ needs/ wants, consistently and continually adapting its business operations, communications, and connecting with the customers accordingly then it is eventually perceived as Customer-driven – or so goes the Amazon story. A possible list of Working-backwards strategies include:
Customer communications, messaging, cross-sell/ up-sell recommendations, digital marketing (SEO/ SEM), social targeting driven by customer relevance (consideration, preference, conversion)
Promotion planning based on customer response and channel affinity
Online and offline advertising based on customer clickthrough and conversion propensities
Inactivity and churn managed, and loyalty rewarded, based on customer lifecycle segmentation and predictive targeting
Life-stage events (birthday, student, newly wedded, new parent, retirement) and lifestyles (diets, on-the-go professional, deal-seeker, brand-loyal, luxury-buyer) anticipated for and proactively communicated
Pricing decisions based on customer sensitivity to changes in price (pricing elasticity of demand)
Shipping and handling rates optimized according to customer sensitivity (cart abandonment rate)
Inventory and assortment planning decisions based on customer demand
Contact center, customer service and delivery operations prioritized according to customer segment and lifetime value
Store layout and space allocation driven of customer behavior, survey and planograms
The ranking of sellers (in a marketplace setting) modeled after consumer choice and seller performance – not just the price
The back-office operations and planning (financial planning, fraud detection, warehouse optimization/ layout planning and logistics) based on customer demand, share of wallet and lifetime value
All these and more lie in the data, awaiting to be discovered. When a business makes data-driven magic for its customers, when the customers feel they are treated individually – not as a segment, when their needs/ wants are anticipated for and communicated, then an enduring, rewarding relationship, a silent dialogue with the customer is activated.
With its data science, engineering, real-time platforming and experimentation capabilities DatAcxion can help your business make data-driven decisions in this Customer-first economy for double-digit growth in customer engagement, loyalty and lifetime value.
How a data‑driven decisioning workflow transformed 30,000 raw YouTube videos into a refined shortlist of 70 high‑impact influencers
🎣 A single viral video has the power to transform a brand’s visibility from obscurity to mainstream prominence overnight. However, this phenomenon is not a random occurrence, as many brand marketers believe.
At datAcxion, we have developed a precise, reproducible process that moves beyond vague pros/cons lists and black-box AI hype. We utilize straightforward data ingestion, feature engineering, dimensionality reduction, and machine learning to periodically score and assess influencer potential.
TL;DR
We ingested over 8,000 columns of data from over 30,000 YouTube videos for an industry vertical. We cleaned and enriched this data with over 70 metrics, reducing the feature space to five interpretable dimensions. We subsequently built “reliability” and “favorability” scores at the influencer channel level, delivering a ranked list of 70 influencers (down from 5,300) that significantly outperformed our client’s legacy house list.
It might sound cliché but influencer marketing can be incredibly effective when executed correctly, in a way that traditional marketing channels may not achieve at the same speed and scale.
The challenge is identifying the right influencers – whether macro, micro, or nano – for your specific brand, objectives, and budget. Our data-driven approach helps you navigate this complex landscape. We will detail how we methodically navigate this vast, ever-changing landscape, addressing the limitations of existing tools which are often fragmented, reactive, outdated, prone to fraud, and fail to connect influencer efforts to tangible business outcomes.
Objectives
We recently worked with a client to enhance their social media marketing for a new product launch in the U.S. Traditionally, they relied on an in-house list of two dozen influencers. The objectives were to:
Benchmark their existing influencer list against a broader range of influencers in their vertical.
Develop a method for comparing and ranking influencers.
Identify a shortlist of influencers and brand partners for future collaborations.
Given our client’s focus on in-depth video reviews rather than short-form content, we focused on YouTube and two other niche platforms relevant to their industry.
Data Ingestion, Filtering and Generative AI
Using the YouTube API, we searched the YouTube video library with keywords related to the product launch. This yielded approximately 30,000 videos from over 5,300 unique channels. We initially filtered these down to about 2,000 channels based on subscriber count and lifetime videos, then further refined the list to about 1,300 channels based on the number and timing of video releases in the past 12 months.
Finally, we utilized generative AI and LLMs to remove irrelevant channels (such as related toy or video game reviews), channels publishing only short-form content, and non-U.S./non-English channels.
We also used LLMs to analyze over 700,000 viewer comments to generate sentiment (positive, negative, neutral, mixed) and to identify flags such as spam, toxic, irrelevant, questions, impressed, skeptical, and funny comments.
The refined list of influencers, comprising 792 channels, was shared with the client.
Data Engineering and Machine Learning
In total, we have extracted over 8,000 columns of data per channel. From this data, we engineered over 70 metrics/features per channel, including:
Engagement rates.
Views, likes, and shares.
Comments, comment likes, and sentiment per comment.
Video release velocities and growth over time.
Time-/recency based features and video/channel tenure.
Virality potential. Reliability or fraud potential. An authority scorecard, which we call the favorability score.
We used dimensionality reduction to reduce the metric space to five dimensions. These were then used in a machine learning model to predict favorability (see below). The model is used for periodic re-ranking of influencers following data refreshes and to assess how new influencers compare against established norms.
Dimensions
Description
Metric Importance
Favorability Impact
I
Engagement, likes, views, subscribers
29%
0.17
II
Comments related
23%
0.63
III
Video growth, tenure, time-based features
19%
0.04
IV
Counts of video, views, like events
17%
-0.08
V
Subscriber summaries,virality, (+) sentiment
13%
0.08
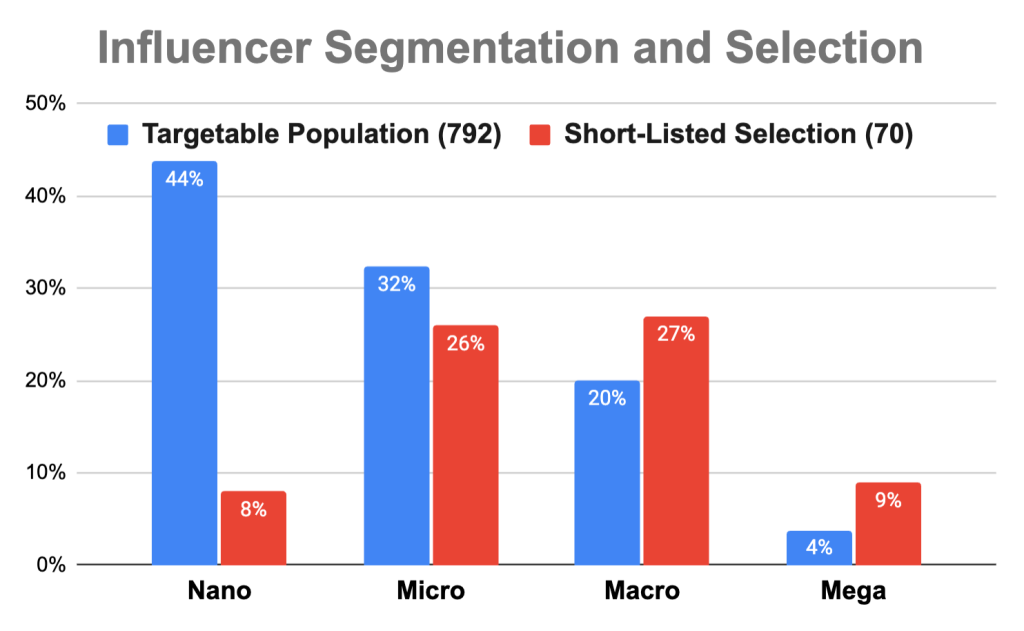
Influencer Segmentation and Selection
We’ve further ranked the 792 targetable channels to identify a shortlist for the upcoming campaigns. Our anomaly detection algorithm flagged 56 influencers (7%) as outliers.
From the remaining channels, we developed a shortlist of 70 influencers: 45 as top recommendations and 25 as secondary reserves. The shortlist prioritizes reliability and favorability, and ensures selections are among the top performers in terms of engagement, select lifetime metrics, and overall positive sentiment in user comments. The selection aligned with our client’s need to send out two batches of 25 products for in-depth video reviews across two different campaigns.
The influencer segment distributions are depicted below. Nano-influencers (less than 10K subscribers) represent 44% of the total population but only 8% of our top selections. Another third are micro-influencers (less than 100K subscribers), with the remainder being macro (less than 1M subscribers) and mega influencers (1M+ subscribers).
A diverse influencer portfolio can be highly effective, as nano and micro-influencers offer niche authority and highly engaged audiences, while macro and mega-influencers provide broad reach and mass brand awareness.
The House List, Testing and Measurement
A key objective was to benchmark our client’s existing influencer list against the broader industry. We found that only a third of their house-list of two dozen influencers appeared within the 792 channels we identified, and only one made it onto our shortlist of 70. The others were filtered out due to factors such as channel description, relevance, video recency, low behavioral counts, video format, or LLM filtering.
Our client operates in an industry with direct product ad placement restrictions. Going with the adage “you can’t manage what you can’t measure”, their campaign measurement focus will be on A/B testing specific variables. These include influencer tier (nano+micro vs. macro), video length, product integration style (demo vs. straight-talk endorsement), upload days (weekday vs. weekend), cross-platform teasers (no teaser vs. Reelz/TikTok driving traffic to YouTube), title aand description copy (keyword-rich vs. curiosity-driven, bulleted vs. paragraph), and affiliate brand placement (description only vs. description and pinned comment).
Takeaways for Marketers and Data Scientists
Winning in influencer marketing should not feel like a lottery: Don’t rely on gut feel or legacy lists, missing high-potential creators. Fraud, fake followers, and vague attribution plague the industry. The following reflects on our lessons learned:
Influencer quality is multi-dimensional: Rely on a composite score (engagement + sentiment + growth) rather than on follower count or views alone.
Transparency winsinternal buy‑in: Ability to explain a score as to why/ how a nano influencer ranks higher than a macro influencer is key to win over brand teams.
Diversity of tier beats “all‑macro/mega”: A mixed portfolio balances reach, cost, and audience authenticity.
Raw data is noisy: Extensive prep, cleaning and filtering using LLMs are essential to prune irrelevant and unreliable creators.
Dimensionality reduction clarifies signal: Use PCA or embeddings (t‑SNE) to compress the feature space into a handful of interpretable axes.
If you’re curious how a data‑first influencer pipeline could look for your brand – whether you’re in beauty, fashion, retail or fintech – drop a comment below or reach out directly at [email protected] We are happy to share a demo, discuss ideas, or explore partnership opportunities. We have developed solutions for 20% of categories that cover 80% of economic activity, including: beauty & cosmetics, apparel & fashion, health & fitness, food & beverage, travel & hospitality, consumer tech & gadgets, financial services & fintech and automotive.
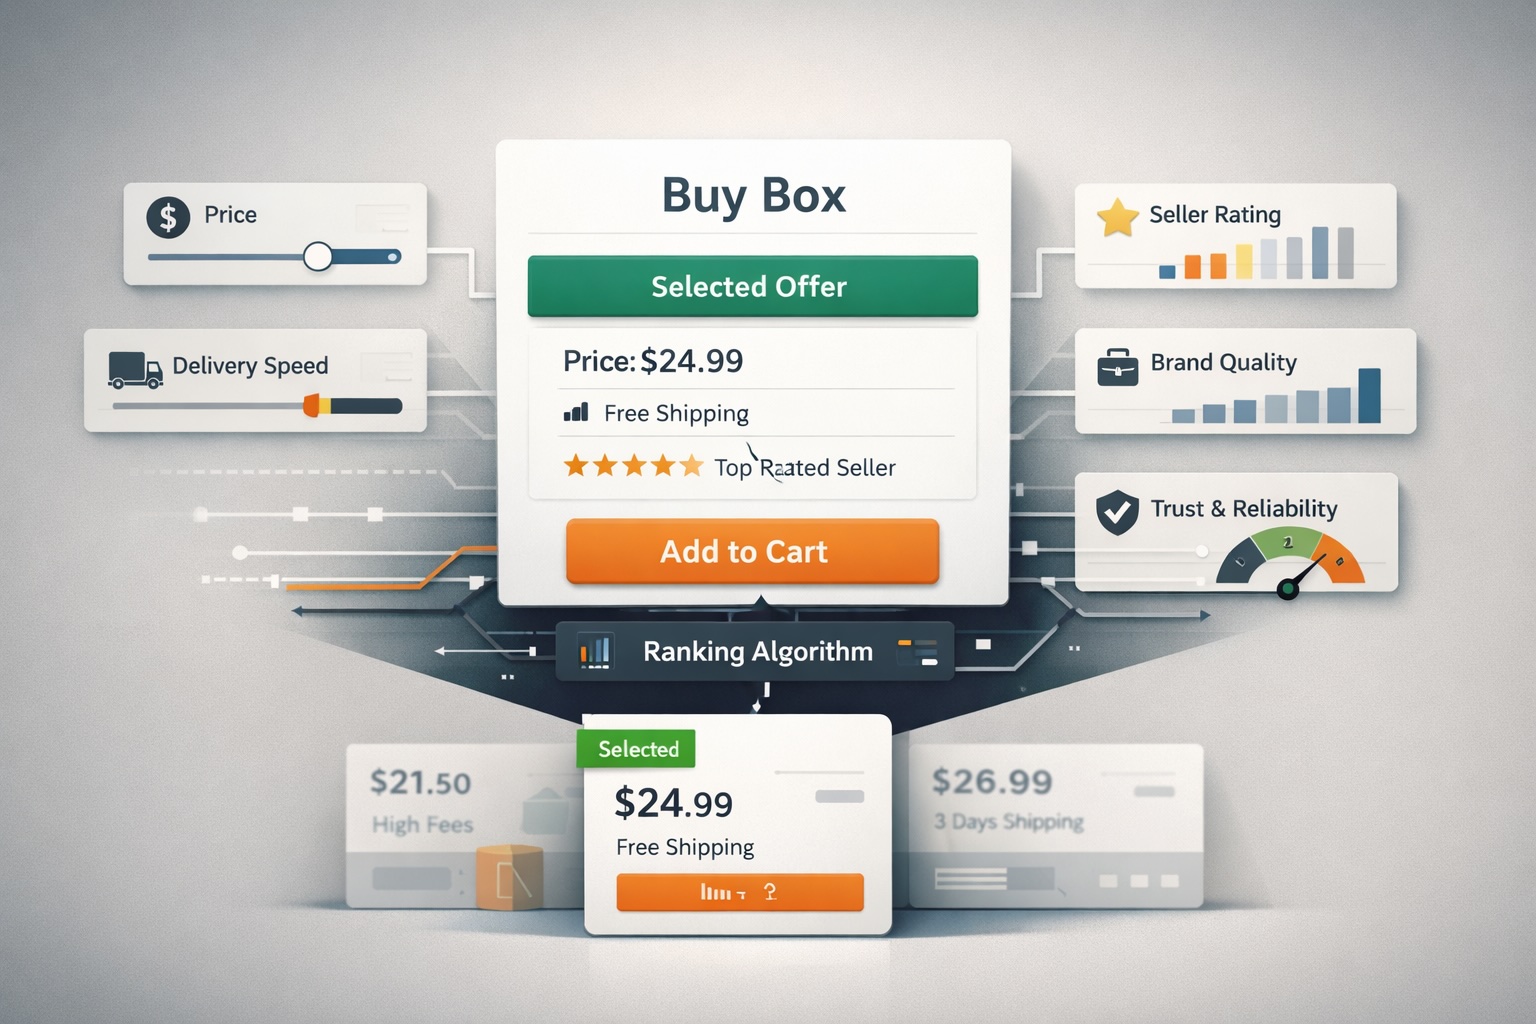
Abstract— Online shoppers use the Buy Box to add products to shopping carts. The majority of online marketplace businesses don’t have a clear strategy in managing their Buy Box. Most rank sellers based on price as the first criterion. This is just one criterion that influences the buyers’ decision making process. They also care about the shop brand name, delivery time, seller experience and reputation. Ranking based on price alone can lead to price wars, eroding margins, leading to seller attrition, shrinking selection and customer attrition. The few online marketplaces, including Amazon, that methodically manage their Buy Box, do so based on complex scorecards where the feature weights are manually set. This too is not optimal, as sellers can and do game the system, which could again lead to customer attrition. In this paper, we present a methodology to manage the Buy Box based on buyer preference using a discrete choice model from econometrics. Learning and applying the preferences of the buyers strike a balance between the needs and wants of the sellers and the marketplace business itself, ensuring success and survival for all parties involved. Our model-based Buy Box solution has been live tested successfully against the existing rule-based alternative, delivering double digit growth in add-to-cart rate, conversion and revenue. The algorithm has been in production serving the site in real-time since January 25, 2017.
Keywords— Discrete choice, decision tree, seller ranking, randomized experiment, live A/B testing, performance measurement, online marketplaces, business strategy and real-time scoring.
1. Introduction
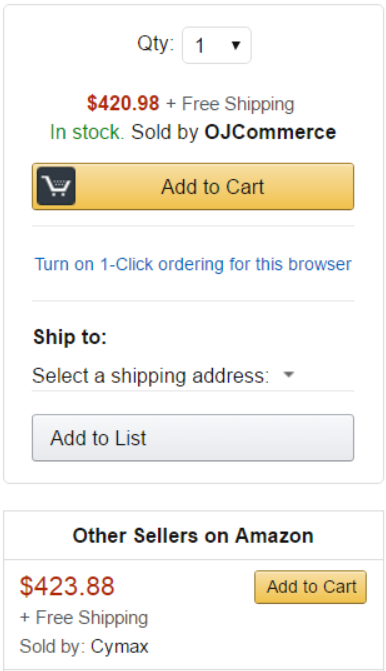
In online shopping Buy Box refers to the area or box on a product detail page, a product category page or a search engine results page where buyers begin the purchasing process by adding items to their shopping cart. In an online marketplace, one or more sellers of a product competes for buyers’ attention on a product detail page. Where there is only a single seller, that seller becomes the de-facto winner of the Buy Box. When more than one seller offers the same product, one of them wins the Buy Box while others are listed below the Buy Box (see Fig. 1) or on a separate webpage.
Winning the top position is critical for a seller. However, pushing the right seller to the top for the right customer experience is also critical for the success of the marketplace business.
2. Background and Approach
82% of Amazon sales [1], 83% of HepsiBurada sales go through the Buy Box. Such a prominent spot inadvertently affects many key performance indicators (KPIs) of an online retail business from customer trust, customer satisfaction and loyalty, to convenience, selection, pricing, conversion, revenue and profitability.
Fig. 1 – A Buy Box Example on Amazon.com
As the majority of sales go through the Buy Box, the algorithm itself is effectively a pricing algorithm. If an online marketplace business does not exert control over its Buy Box and rolls out a simple rule, such as “the-minimum-price-wins-the-Buy-Box”, then the sellers will begin competing on price [2], slowly eroding business margins, and profitability. The brands and large sellers will gradually leave the platform, taking the selection and quality with them and thus causing the buyers to attrite as they will not find what they are looking for. Therefore, it’s important for an online marketplace to strike a balance in its pricing policy between the needs/wants of its sellers and the marketplace business itself. Striving to be “an everyday low price seller” in this regard, and not the lowest price seller, is the best long term strategy for the business. Our Buy Box algorithm provides for this by the virtue of continually regressing to the mean conversion/purchase incidence rate it models after.
It’s also important for a retail marketplace to deploy a buyer-first approach in the design of its Buy Box algorithm, and not seller-first. A Buy Box algorithm modeled after the buyer behavior (e.g., conversion) will increase customer trust and loyalty over time, which in turn will ensure that the sellers keep coming back to the platform, further growing the selection and convenience, leading to an ever growing customer base.
The success of the Buy Box algorithm depends on not publicly releasing the exact recipe or formula. Not doing so leads to algorithmic sellers taking advantage of the platform [2]. The algorithmic sellers adjust prices directly through the application programming interfaces (APIs) or use dynamic pricing tools (e.g., Sellery, Feedvisor or RepriceIt). Through programmatic trial and error, they decipher much of the Buy Box algorithm; they reprice to continually win the Buy Box. Due to their volume, they disproportionately grow their reviews/ratings, which in turn leads to even more Buy Box wins. A distinct feature of these sellers is their exclusive focus on the best-selling products, a limited number of products that make up the majority of the revenue. Once the algorithm is deciphered, the Buy Box gets dominated by a few algorithmic sellers. Small to medium size merchants’ ability to win the Buy Box dissipates, which causes them to slowly leave the platform, the selection and convenience shrinks, and the buyers eventually follow suit.
Another consequence of having a few sellers dominate the Buy Box is loss of pricing control, which in its extreme form can result in price collusion and price fixing [3], which again results in the customers leaving the platform.
To get around these issues, we modeled the Buy Box after buyer preference. In our opinion, this buyer-first strategy is the only way to strike a balance between the needs and wants of the sellers and the marketplace business itself, while keeping the customers satisfied. We achieved this by collecting buyer preference data through a randomized experimentation and using a discrete choice modeling technique from econometrics to model the seller position on a product detail page. In the rest of the paper, we provide the data and model details behind the algorithm. We report the results of a market test that resulted in double digit growth in the business KPIs of interest (i.e., add-to-cart rate, conversion and revenue) as a result of deploying the algorithm.
3. Data
There are three areas on a product detail page at HepsiBurada’s (henceforth HB) website where sellers are listed: the Buy Box, the Other Sellers area below the Buy Box where the second and third sellers are listed, and the All-Sellers area below the fold, in a separate tab where all the sellers are listed for completeness. The buyers see the following information on a product detail page: the product price, the delivery time (a.k.a. the dispatch time) offered by the seller, the name of the seller and the seller’s rating. Before we deployed our algorithm, the existing rule-based Buy Box algorithm (henceforth the default algorithm) ranked sellers based on price, then by alphabetic order of seller name. Additionally, the existing algorithm pushed HB to the top position in Buy Box when HB was a seller of the item and the item shipped the same day.
To avoid the selection bias evident in the default algorithm and to observe buyers in their natural state, we rolled out a data collection experiment whereby the seller order in product detail pages was randomized for 5% of traffic. Doing so, we assumed that the buyers exposed to the randomized test would have the opportunity to evaluate all alternative sellers of a product before choosing the utility maximizing seller to buy from.
Apart from the features buyers see on a product detail page (i.e., price, delivery time, seller name and seller rating), we assume that the buyers are also influenced by their prior purchase experiences. For this we considered historical seller performance data (sales volume, returns and cancels) as a proxy.
Established in 1998, HB is the number one online retailer in Turkey and Eastern Europe in terms of visits (65MM/month), and was also selected as the top brand in Turkey for three consecutive years by Lovemark. As HB started its online marketplace operations in June 2015, we also included an indicator in the model to control for the brand effect when HB was listed as a seller of the product. Table 1 lists the full set of features included in the model.
Where possible, we included two versions of a feature in the model: the first one represented the level effect (e.g., product price), and the other represented the change/slope effect (e.g., percent difference from the minimum price). Additional features we considered include shipping and handling costs, merchant-level marketing campaign data, customer complaint data and seller fraud data. However, the current release of the algorithm does not include these features in the model as they were not available in real-time during model scoring. Also, we did not include the stock count in the model due to data reliability and collinearity issues.
Table 1 – Features Included in the Model
Model Features
Feature Definitions
Seller Price
Product Price Offered by Seller
Percent Difference in Price
Percent Difference in Price with the Minimum Price Seller
Product Ship(/Dispatch) Time
Time (# of days) it takes to ship the item
Minimum Delivery Time Flag
Whether the seller offers the minimum delivery time among alternative sellers
Same-day Delivery Flag
Whether the seller offers same day shipment
Seller Historical Sales Volume
Products sold in trailing one month
Seller Cancel Rate
Percentage of sales cancelled in the trailing month
Seller Return Rate
Percentage of sales returned in the trailing month
Merchant Rating
Weighted average of customer feedback rating for delivery timeliness, packaging and overall experience
Hepsiburada Brand Flag
Whether the seller is Hepsiburada
4. Model
We consider an optimal Buy Box solution to be one that offers the best possible shopping experience to buyers over time (utility maximizing) while building trust in the brand and making it harder for the sellers to game the system (i.e., deciphering the system through dynamic pricing strategies). Thus, we have chosen to model the Buy Box after buyer conversion (i.e., binary purchase incidence). So that the result would be used to rank the sellers from most likely to least likely based on probability of conversion.
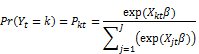
The standard logit model does not apply in our case as the buyers evaluate all alternatives sellers of a product, dubbed a choice set, before settling down with the utility maximizing alternative. As such, for a buyer, the decision lies within a choice set and not across sets. Hence, we modeled the intra-set purchase incidence as a discrete choice problem [5]. The buyer selects one and only one alternative from a choice set with alternatives. Within the discrete choice framework, we used the conditional logit model. The conditional logit considers only the attributes of the alternatives (i.e., the sellers) and not the attributes of the buyers. When the business is ready, we will deploy the multinomial logit model in a subsequent release. The multinomial logit considers the attributes of the buyer (e.g., purchase intent, price sensitivity, shipping and handling fee sensitivity, brand sensitivity and/or demographics…) in addition to the attributes of the seller, personalizing the Buy Box for a customer.
The conditional logit model deals with alternatives where the utility for alternative is
where is iid Gumbel distributed. The Gumbel distribution has density function and distribution function . The probability that alternative is chosen is for which is
A vector of regressors is associated with each alternative ( vectors of regressors) and there is one parameter vector for the model, making the conditional logit regressors the attributes associated with the specific-alternatives. The odds ratio for conditional logit is then
again independent of other alternatives (IIA). [4].
Sample model results for select categories are listed below.
Table 2 – Standardized Beta CoefficientsA
Category
Price
Delivery Time
Seller Performance
Seller Rating
HB Brand Flag
Overall
-4.09
0.133
0.227
0.09
0.339
Electronics
-4.848
0.09
0.262
0.097
0.348
Non-Electronics
-3.155
0.134
0.228
0.055
0.359
Books
-3.537
0.144
0.032
0
0.434
Cell Phones
-3.813
0.081
0.236
0.14
0.423
Computers
-2.52
0.123
0.264
0.078
0.353
FMCG
-0.687
0
0.223
0.1
0.623
Health& Beauty
-1.744
0.126
0.228
0.083
0.46
Sports
-2.221
0.201
0.301
0.112
0.429
A All coefficients are significant at 0.999 level of confidence
Overall, the price has the highest effect on purchase incidence, as expected. This is followed by HB’s brand effect, seller performance (sales volume, returns and cancels), delivery time, and the seller rating. Compared to Non-electronics, the price has a higher effect in Electronics. The delivery time has relatively little to no effect in Cell Phones & Accessories and FMCG as HB is a frequent seller in these categories with same day shipping. This also leads to significantly higher HB brand effects in these categories. The seller performance has significant effects in most categories except Books, where HB is almost an exclusive seller. The model AUC is 0.84 (see Table 3 for fit statistics).
Table 3 – Model Fit Statistics for Non-Category Specific Overall Model
Measure
Formula B
Value
Likelihood Ratio
31,066
Upper Bound of LR
168,034
Aldrich-Nelson
0.369
Cragg-Uhler 1
0.443
Cragg-Uhler 2
0.463
Estrella
0.477
Adjusted Estrella
0.477
McFadden’s LRI
0.185
AIK
136,998
Schwarz Criterion
137,077
AUC
Area under curve
0.84
B The notes pertaining to the formula are as follows:
1. L is the maximum of the log-likelihood function and is the maximum of the log-likelihood function when all coefficients, except for an intercept term, are zero
2. N is the number of observations used and K represents the number of estimated parameters
3. R is the likelihood ratio and U is the upper bound of likelihood ratio
The business dictated a requirement to override the algorithm’s decision and push HB to the top position in Buy Box when HB sold the item and the item shipped the same day and its price was not significantly higher than the cheapest marketplace seller’s offer. To accommodate this request, we fitted a two-prong solution: first, we split the price distribution of items sold at HB into quintiles, we then fitted a decision tree to each quintile to optimally split the price difference between HB and the cheapest price offered by the marketplace seller. The positive target label referred to product purchases from HB whilst the negative target label referred to product purchases from the marketplace sellers. The resulting exception is labeled “HepsiBurada Auto-win” rule (see table 4). For example, for items priced between 20 TL and 50 TL, HB won the Buy Box for the most part when it offered same-day shipping and its price was up to 6.4% higher compared to the marketplace sellers. The results suggested that as the price went up to 500 TL (i.e., the more luxury the item) the buyers mostly favored HB with same-day shipping and up to 10% price difference compared to the marketplace sellers. The buyers are price sensitive for items more than 500 TL.
Table 4 – Hepsiburada Auto-win Thresholds by Price Quintiles
Price Quintiles
HepsiBurada Auto-Win %
0 TL – 20 TL
5.4%
20 TL – 50 TL
6.4%
50 TL – 200 TL
8.5%
200 TL – 500 TL
9.8%
500 TL +
0.4%
5. Live A/B Test Results and Analysis
The model has been live-tested against the existing rule-based algorithm. Accordingly, compared to the control group (the existing rule), the new Buy Box algorithm’s add-to-cart rate was 10% higher, the conversion was 16% higher and the order value was 17% higher. More importantly, the algorithm led to 25% fewer cart-adds thorough the “Other-Sellers” area (2nd and 3rd positions under the Buy Box) and 18% fewer cart-adds through the “All-Sellers” tab (a separate tab below the fold where all sellers are listed); thus, providing the shortest path (and time) to conversion. The new Buy Box algorithm has been in production serving the site in real-time since January 25, 2017. As such, the algorithm continues to establish trust and loyalty in the HepsiBurada brand.
Table 5 – Live A/B Test Results
Metric
A: Treatment Buy Box Algo.
B: Control Old Rule
Difference
Visits
70,177
73,433
–
Add-to-Cart %
10.95
9.96
9.9%
Conversion Rate
3.66
3.15
16.2%
Orders
2,262
2,035
11.2%
Order Value
644,741 TL
551,988 TL
16.8%
Average Order Value
285 TL
271 TL
5.1%
Other-Sellers Add-to-Cart %
0.76
1.01
-24.8%
All-SellersAdd-to-Cart %
0.23
0.28
-17.9%
Compared to the existing, rule-based Buy Box algorithm, with the new, model-based algorithm, the Buy Box changed hands 16% of the time in Electronics and 9% of the time in Non-Electronics. With the new algorithm and the HB Auto-win rule, HB won the Buy Box 51% of the time whereas with the existing, rule-based algorithm HB won the Buy Box 65% of the time. In other words, the new algorithm dropped HB from the Buy Box 14% of the time, when HB would have won the Buy Box unfairly at higher prices.
With the existing, rule-based algorithm, the Buy Box price was on average 9.4% higher than the lower price marketplace seller when HB won the Buy Box. Whereas with the new, model-based algorithm, when HB won the Buy Box, the price was on average 3.4% higher than the lower price marketplace seller (albeit the auto-win rule). We think these contributed to the significant increase in conversion during the live A/B test.
Based on these live A/B test results, the new algorithm was put in production and has been serving the site in real-time since January 25, 2017. Since its inception, sellers with a lower price won the Buy Box 43% of the time while 57% of the time sellers with a higher price won the Buy Box. The lower price wins was due to faster delivery times and higher seller ratings 25.9% of the time; whereas the higher price wins was primarily due to the same 40.6% of the time.
Table 6 – Analysis of and Reasons for Wins
Wins
Reasons for Winning
Percent
Sellers with the lower price won the buy-box 43% of the time
Minimum delivery time and maximum seller rating
25.9%
Minimum delivery time but lower seller rating
11.6%
Maximum seller rating but higher delivery time
3.3%
Maximum seller performance but higher delivery time and lower seller rating
2.2%
Higher delivery time, lower seller rating and lower seller performance
0.0%
Sellers with the higher price won the buy-box 57% of the time
Minimum delivery time and maximum seller rating
40.6%
Minimum delivery time but lower seller rating
13.1%
Maximum seller rating but higher delivery time
2.4%
Maximum seller performance but higher delivery time and lower seller rating
0.9%
Higher delivery time, lower seller rating and lower seller performance
0.0%
6. Additional Features and Next Steps
The models are updated weekly in an open-source (Hadoop) batch environment, whereas the scoring is happening in real-time on the site. Based on the success of the application thus far, the following additional features are planned for the next release: (1) rank sellers based on expected revenue(/profit), which is the product of purchase incidence probability and predicted revenue(/profit); also use the total price of ownership inclusive of the shipping and handling fees; (2) develop separate Buy Box models by price range and/or by price sensitivity within a category; (3) build and test a personalized, customer-level Buy Box ranking that considers not only the attributes of the sellers (conditional logit) but also the attributes of the buyers (multinomial logit); (4) build a Buy Box simulator to be used by the sellers as a pricing aid, based on confidence intervals around historical Buy Box prices and positions; (5) to control for possible selection bias and consider the different purchase modes offered on site, model Buy Box in two stages (add-to-cart followed by conversion) instead of the current, single-stage conversion model.
7. Conclusion
Based on our literature review, our work is the first of its kind in applying a discrete choice model from econometrics to stack rank sellers on an e-commerce product detail page based on buyer preference and the attributes of the sellers. We used the conditional logit algorithm to learn the feature weights at a product category level.
Ranking sellers price-first is not optimal and leads to price wars, eroding margins, shrinking selection, and even leading to customer attrition. Even the most complex scorecard models, such as those deployed at Amazon, can get exploited by algorithmic sellers. Our approach, by putting the buyers first and frequently updating the models to control for the changing buyer needs/wants/tastes, also safeguards against algorithmic sellers. Even if/when the algorithm gets deciphered, new models are developed weekly, avoiding detection. The algorithm can easily be adapted to incorporate other business criteria such as revenue or profitability, again safeguarding against exploiters.
Having a clear strategy to manage the Buy Box is critical for the survival and success of an online marketplace business. Double digit growth in key performance indicators can be had with a model-based approach. Focusing on the buyer and tuning the Buy Box accordingly keeps buyers happy and ensures their retention. The sellers naturally follow suit. Thus, letting the buyers “own” the exact formula of the Buy Box, and not the sellers, can guarantee this outcome.
References
D. K. Taft. Amazon buy box: The internet’s $80 billion sales button. eWeek. October 2014. http://www.eweek.com/enterprise-apps/slideshows/ amazon-buy-box-the-internets-80-billion-sales-button.html.
L. Chen, A. Mislove, and C. Wilson. 2015. An Empirical Analysis of Algorithmic Pricing on Amazon Marketplace. http://www.ccs.neu.edu/home/amislove/publications/Amazon-WWW.pdf.
Department of Justice, Online Marketplace Prosecution. April 2015.
Douglas A. Schroeder. 2010. Accounting and Causal Effects: Econometric Challenges. Pages 77-95. http://dx.doi.org/10.1007/978-1-4419-7225-5_5.
Shelley Farrar, Mandy Ryan, Donald Ross, and Anne FLudbrook. 2000. Using discrete choice modelling in priority setting: an application to clinical service developments. Volume 50, Issue 1, January 2000. Pages 63-75. ISSN 0277-9536. http://dx.doi.org/10.1016/S0277-9536(99)00268-3.
M. Ryan, K. Gerard, and M. Amaya-Amaya. 2008. Using Discrete Choice Experiments to Value Health and Health Care. http://www.ccs.neu.edu/home/amislove/publications/Amazon-WWW.pdf.
P. Bahl, R. Chancre, and J. Dungeon. 1981. Applied Discrete Choice Modelling.
David A. Hensher. 1982. Functional measurement, individual preference and discrete-choice modelling: Theory and application. Journal of Economic Psychology. Volume 2. Issue 4. Pages 323-335. ISSN 0167-4870. http://dx.doi.org/10.1016/0167-4870(82)90035-6. http://www.sciencedirect.com/science/article/pii/0167487082900356
D. K. Taft. Amazon buy box: The internet’s $80 billion sales button. eWeek. October 2014. http://www.eweek.com/enterprise-apps/slideshows/ amazon-buy-box-the-internets-80-billion-sales-button.html.