Modeling the Buy-Box: Ranking Sellers on E-commerce Product Detail Pages based on Buyer Preference
| Ismail Parsa datAcxion [email protected] | Nezir Alp Trendyol [email protected] |
Abstract— Online shoppers use the Buy Box to add products to shopping carts. The majority of online marketplace businesses don’t have a clear strategy in managing their Buy Box. Most rank sellers based on price as the first criterion. This is just one criterion that influences the buyers’ decision making process. They also care about the shop brand name, delivery time, seller experience and reputation. Ranking based on price alone can lead to price wars, eroding margins, leading to seller attrition, shrinking selection and customer attrition. The few online marketplaces, including Amazon, that methodically manage their Buy Box, do so based on complex scorecards where the feature weights are manually set. This too is not optimal, as sellers can and do game the system, which could again lead to customer attrition. In this paper, we present a methodology to manage the Buy Box based on buyer preference using a discrete choice model from econometrics. Learning and applying the preferences of the buyers strike a balance between the needs and wants of the sellers and the marketplace business itself, ensuring success and survival for all parties involved. Our model-based Buy Box solution has been live tested successfully against the existing rule-based alternative, delivering double digit growth in add-to-cart rate, conversion and revenue. The algorithm has been in production serving the site in real-time since January 25, 2017.
Keywords— Discrete choice, decision tree, seller ranking, randomized experiment, live A/B testing, performance measurement, online marketplaces, business strategy and real-time scoring.
1. Introduction
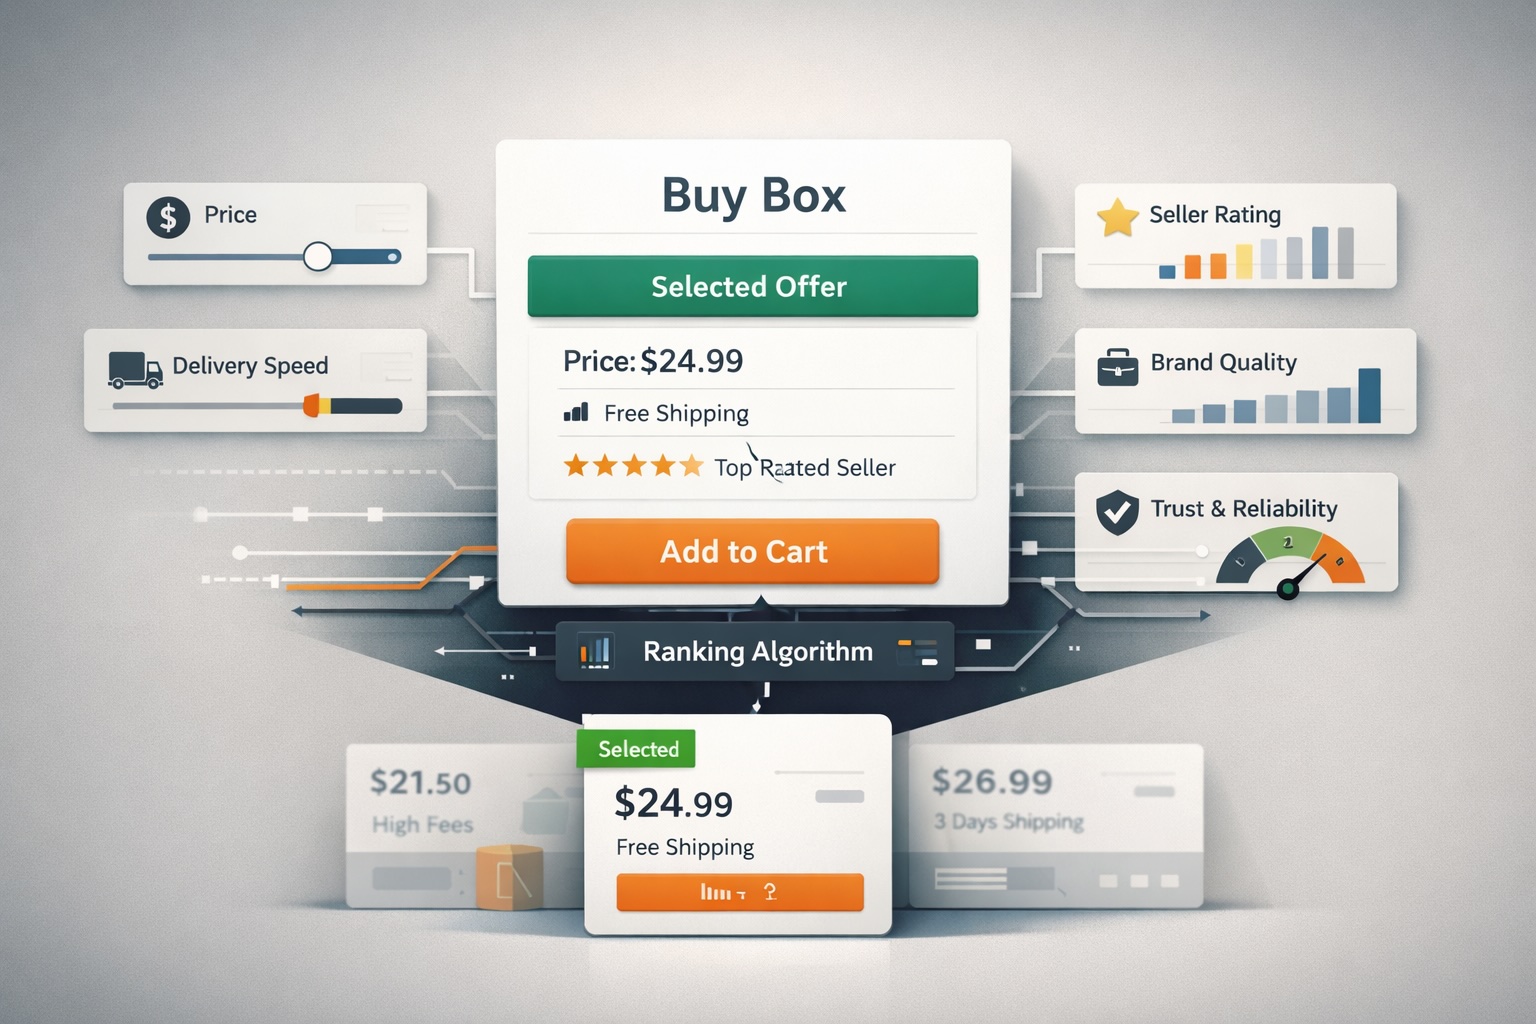
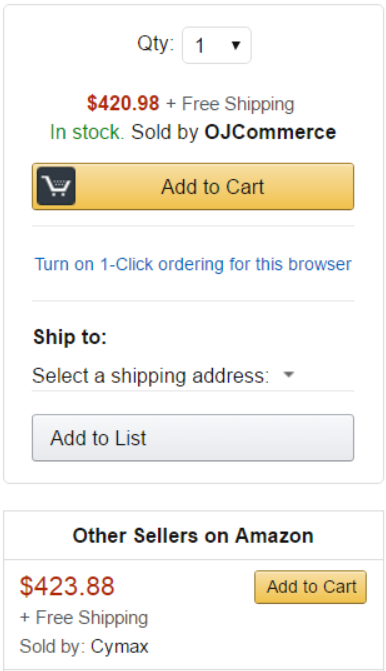
In online shopping Buy Box refers to the area or box on a product detail page, a product category page or a search engine results page where buyers begin the purchasing process by adding items to their shopping cart. In an online marketplace, one or more sellers of a product competes for buyers’ attention on a product detail page. Where there is only a single seller, that seller becomes the de-facto winner of the Buy Box. When more than one seller offers the same product, one of them wins the Buy Box while others are listed below the Buy Box (see Fig. 1) or on a separate webpage.
Winning the top position is critical for a seller. However, pushing the right seller to the top for the right customer experience is also critical for the success of the marketplace business.
2. Background and Approach
82% of Amazon sales [1], 83% of HepsiBurada sales go through the Buy Box. Such a prominent spot inadvertently affects many key performance indicators (KPIs) of an online retail business from customer trust, customer satisfaction and loyalty, to convenience, selection, pricing, conversion, revenue and profitability.
Fig. 1 – A Buy Box Example on Amazon.com
As the majority of sales go through the Buy Box, the algorithm itself is effectively a pricing algorithm. If an online marketplace business does not exert control over its Buy Box and rolls out a simple rule, such as “the-minimum-price-wins-the-Buy-Box”, then the sellers will begin competing on price [2], slowly eroding business margins, and profitability. The brands and large sellers will gradually leave the platform, taking the selection and quality with them and thus causing the buyers to attrite as they will not find what they are looking for. Therefore, it’s important for an online marketplace to strike a balance in its pricing policy between the needs/wants of its sellers and the marketplace business itself. Striving to be “an everyday low price seller” in this regard, and not the lowest price seller, is the best long term strategy for the business. Our Buy Box algorithm provides for this by the virtue of continually regressing to the mean conversion/purchase incidence rate it models after.
It’s also important for a retail marketplace to deploy a buyer-first approach in the design of its Buy Box algorithm, and not seller-first. A Buy Box algorithm modeled after the buyer behavior (e.g., conversion) will increase customer trust and loyalty over time, which in turn will ensure that the sellers keep coming back to the platform, further growing the selection and convenience, leading to an ever growing customer base.
The success of the Buy Box algorithm depends on not publicly releasing the exact recipe or formula. Not doing so leads to algorithmic sellers taking advantage of the platform [2]. The algorithmic sellers adjust prices directly through the application programming interfaces (APIs) or use dynamic pricing tools (e.g., Sellery, Feedvisor or RepriceIt). Through programmatic trial and error, they decipher much of the Buy Box algorithm; they reprice to continually win the Buy Box. Due to their volume, they disproportionately grow their reviews/ratings, which in turn leads to even more Buy Box wins. A distinct feature of these sellers is their exclusive focus on the best-selling products, a limited number of products that make up the majority of the revenue. Once the algorithm is deciphered, the Buy Box gets dominated by a few algorithmic sellers. Small to medium size merchants’ ability to win the Buy Box dissipates, which causes them to slowly leave the platform, the selection and convenience shrinks, and the buyers eventually follow suit.
Another consequence of having a few sellers dominate the Buy Box is loss of pricing control, which in its extreme form can result in price collusion and price fixing [3], which again results in the customers leaving the platform.
To get around these issues, we modeled the Buy Box after buyer preference. In our opinion, this buyer-first strategy is the only way to strike a balance between the needs and wants of the sellers and the marketplace business itself, while keeping the customers satisfied. We achieved this by collecting buyer preference data through a randomized experimentation and using a discrete choice modeling technique from econometrics to model the seller position on a product detail page. In the rest of the paper, we provide the data and model details behind the algorithm. We report the results of a market test that resulted in double digit growth in the business KPIs of interest (i.e., add-to-cart rate, conversion and revenue) as a result of deploying the algorithm.
3. Data
There are three areas on a product detail page at HepsiBurada’s (henceforth HB) website where sellers are listed: the Buy Box, the Other Sellers area below the Buy Box where the second and third sellers are listed, and the All-Sellers area below the fold, in a separate tab where all the sellers are listed for completeness. The buyers see the following information on a product detail page: the product price, the delivery time (a.k.a. the dispatch time) offered by the seller, the name of the seller and the seller’s rating. Before we deployed our algorithm, the existing rule-based Buy Box algorithm (henceforth the default algorithm) ranked sellers based on price, then by alphabetic order of seller name. Additionally, the existing algorithm pushed HB to the top position in Buy Box when HB was a seller of the item and the item shipped the same day.
To avoid the selection bias evident in the default algorithm and to observe buyers in their natural state, we rolled out a data collection experiment whereby the seller order in product detail pages was randomized for 5% of traffic. Doing so, we assumed that the buyers exposed to the randomized test would have the opportunity to evaluate all alternative sellers of a product before choosing the utility maximizing seller to buy from.
Apart from the features buyers see on a product detail page (i.e., price, delivery time, seller name and seller rating), we assume that the buyers are also influenced by their prior purchase experiences. For this we considered historical seller performance data (sales volume, returns and cancels) as a proxy.
Established in 1998, HB is the number one online retailer in Turkey and Eastern Europe in terms of visits (65MM/month), and was also selected as the top brand in Turkey for three consecutive years by Lovemark. As HB started its online marketplace operations in June 2015, we also included an indicator in the model to control for the brand effect when HB was listed as a seller of the product. Table 1 lists the full set of features included in the model.
Where possible, we included two versions of a feature in the model: the first one represented the level effect (e.g., product price), and the other represented the change/slope effect (e.g., percent difference from the minimum price). Additional features we considered include shipping and handling costs, merchant-level marketing campaign data, customer complaint data and seller fraud data. However, the current release of the algorithm does not include these features in the model as they were not available in real-time during model scoring. Also, we did not include the stock count in the model due to data reliability and collinearity issues.
Table 1 – Features Included in the Model
| Model Features | Feature Definitions |
| Seller Price | Product Price Offered by Seller |
| Percent Difference in Price | Percent Difference in Price with the Minimum Price Seller |
| Product Ship(/Dispatch) Time | Time (# of days) it takes to ship the item |
| Minimum Delivery Time Flag | Whether the seller offers the minimum delivery time among alternative sellers |
| Same-day Delivery Flag | Whether the seller offers same day shipment |
| Seller Historical Sales Volume | Products sold in trailing one month |
| Seller Cancel Rate | Percentage of sales cancelled in the trailing month |
| Seller Return Rate | Percentage of sales returned in the trailing month |
| Merchant Rating | Weighted average of customer feedback rating for delivery timeliness, packaging and overall experience |
| Hepsiburada Brand Flag | Whether the seller is Hepsiburada |
4. Model
We consider an optimal Buy Box solution to be one that offers the best possible shopping experience to buyers over time (utility maximizing) while building trust in the brand and making it harder for the sellers to game the system (i.e., deciphering the system through dynamic pricing strategies). Thus, we have chosen to model the Buy Box after buyer conversion (i.e., binary purchase incidence). So that the result would be used to rank the sellers from most likely to least likely based on probability of conversion.
The standard logit model does not apply in our case as the buyers evaluate all alternatives sellers of a product, dubbed a choice set, before settling down with the utility maximizing alternative. As such, for a buyer, the decision lies within a choice set and not across sets. Hence, we modeled the intra-set purchase incidence as a discrete choice problem [5]. The buyer selects one and only one alternative from a choice set with
alternatives. Within the discrete choice framework, we used the conditional logit model. The conditional logit considers only the attributes of the alternatives (i.e., the sellers) and not the attributes of the buyers. When the business is ready, we will deploy the multinomial logit model in a subsequent release. The multinomial logit considers the attributes of the buyer (e.g., purchase intent, price sensitivity, shipping and handling fee sensitivity, brand sensitivity and/or demographics…) in addition to the attributes of the seller, personalizing the Buy Box for a customer.
The conditional logit model deals with alternatives where the utility for alternative
is

where is iid Gumbel distributed. The Gumbel distribution has density function
and distribution function
. The probability that alternative
is chosen is
for
which is
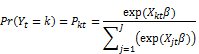
A vector of regressors is associated with each alternative ( vectors of regressors) and there is one parameter vector for the model, making the conditional logit regressors the attributes associated with the specific-alternatives. The odds ratio for conditional logit is then
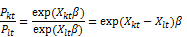
again independent of other alternatives (IIA). [4].
Sample model results for select categories are listed below.
Table 2 – Standardized Beta CoefficientsA
| Category | Price | Delivery Time | Seller Performance | Seller Rating | HB Brand Flag |
| Overall | -4.09 | 0.133 | 0.227 | 0.09 | 0.339 |
| Electronics | -4.848 | 0.09 | 0.262 | 0.097 | 0.348 |
| Non-Electronics | -3.155 | 0.134 | 0.228 | 0.055 | 0.359 |
| Books | -3.537 | 0.144 | 0.032 | 0 | 0.434 |
| Cell Phones | -3.813 | 0.081 | 0.236 | 0.14 | 0.423 |
| Computers | -2.52 | 0.123 | 0.264 | 0.078 | 0.353 |
| FMCG | -0.687 | 0 | 0.223 | 0.1 | 0.623 |
| Health& Beauty | -1.744 | 0.126 | 0.228 | 0.083 | 0.46 |
| Sports | -2.221 | 0.201 | 0.301 | 0.112 | 0.429 |
A All coefficients are significant at 0.999 level of confidence
Overall, the price has the highest effect on purchase incidence, as expected. This is followed by HB’s brand effect, seller performance (sales volume, returns and cancels), delivery time, and the seller rating. Compared to Non-electronics, the price has a higher effect in Electronics. The delivery time has relatively little to no effect in Cell Phones & Accessories and FMCG as HB is a frequent seller in these categories with same day shipping. This also leads to significantly higher HB brand effects in these categories. The seller performance has significant effects in most categories except Books, where HB is almost an exclusive seller. The model AUC is 0.84 (see Table 3 for fit statistics).
Table 3 – Model Fit Statistics for Non-Category Specific Overall Model
| Measure | Formula B | Value |
| Likelihood Ratio | 31,066 | |
| Upper Bound of LR | 168,034 | |
| Aldrich-Nelson | 0.369 | |
| Cragg-Uhler 1 | 0.443 | |
| Cragg-Uhler 2 | 0.463 | |
| Estrella | 0.477 | |
| Adjusted Estrella | 0.477 | |
| McFadden’s LRI | 0.185 | |
| AIK | 136,998 | |
| Schwarz Criterion | 137,077 | |
| AUC | Area under curve | 0.84 |
B The notes pertaining to the formula are as follows:
1. L is the maximum of the log-likelihood function and is the maximum of the log-likelihood function when all coefficients, except for an intercept term, are zero
2. N is the number of observations used and K represents the number of estimated parameters
3. R is the likelihood ratio and U is the upper bound of likelihood ratio
The business dictated a requirement to override the algorithm’s decision and push HB to the top position in Buy Box when HB sold the item and the item shipped the same day and its price was not significantly higher than the cheapest marketplace seller’s offer. To accommodate this request, we fitted a two-prong solution: first, we split the price distribution of items sold at HB into quintiles, we then fitted a decision tree to each quintile to optimally split the price difference between HB and the cheapest price offered by the marketplace seller. The positive target label referred to product purchases from HB whilst the negative target label referred to product purchases from the marketplace sellers. The resulting exception is labeled “HepsiBurada Auto-win” rule (see table 4). For example, for items priced between 20 TL and 50 TL, HB won the Buy Box for the most part when it offered same-day shipping and its price was up to 6.4% higher compared to the marketplace sellers. The results suggested that as the price went up to 500 TL (i.e., the more luxury the item) the buyers mostly favored HB with same-day shipping and up to 10% price difference compared to the marketplace sellers. The buyers are price sensitive for items more than 500 TL.
Table 4 – Hepsiburada Auto-win Thresholds by Price Quintiles
| Price Quintiles | HepsiBurada Auto-Win % |
| 0 TL – 20 TL | 5.4% |
| 20 TL – 50 TL | 6.4% |
| 50 TL – 200 TL | 8.5% |
| 200 TL – 500 TL | 9.8% |
| 500 TL + | 0.4% |
5. Live A/B Test Results and Analysis
The model has been live-tested against the existing rule-based algorithm. Accordingly, compared to the control group (the existing rule), the new Buy Box algorithm’s add-to-cart rate was 10% higher, the conversion was 16% higher and the order value was 17% higher. More importantly, the algorithm led to 25% fewer cart-adds thorough the “Other-Sellers” area (2nd and 3rd positions under the Buy Box) and 18% fewer cart-adds through the “All-Sellers” tab (a separate tab below the fold where all sellers are listed); thus, providing the shortest path (and time) to conversion. The new Buy Box algorithm has been in production serving the site in real-time since January 25, 2017. As such, the algorithm continues to establish trust and loyalty in the HepsiBurada brand.
Table 5 – Live A/B Test Results
| Metric | A: Treatment Buy Box Algo. | B: Control Old Rule | Difference |
| Visits | 70,177 | 73,433 | – |
| Add-to-Cart % | 10.95 | 9.96 | 9.9% |
| Conversion Rate | 3.66 | 3.15 | 16.2% |
| Orders | 2,262 | 2,035 | 11.2% |
| Order Value | 644,741 TL | 551,988 TL | 16.8% |
| Average Order Value | 285 TL | 271 TL | 5.1% |
| Other-Sellers Add-to-Cart % | 0.76 | 1.01 | -24.8% |
| All-SellersAdd-to-Cart % | 0.23 | 0.28 | -17.9% |
Compared to the existing, rule-based Buy Box algorithm, with the new, model-based algorithm, the Buy Box changed hands 16% of the time in Electronics and 9% of the time in Non-Electronics. With the new algorithm and the HB Auto-win rule, HB won the Buy Box 51% of the time whereas with the existing, rule-based algorithm HB won the Buy Box 65% of the time. In other words, the new algorithm dropped HB from the Buy Box 14% of the time, when HB would have won the Buy Box unfairly at higher prices.
With the existing, rule-based algorithm, the Buy Box price was on average 9.4% higher than the lower price marketplace seller when HB won the Buy Box. Whereas with the new, model-based algorithm, when HB won the Buy Box, the price was on average 3.4% higher than the lower price marketplace seller (albeit the auto-win rule). We think these contributed to the significant increase in conversion during the live A/B test.
Based on these live A/B test results, the new algorithm was put in production and has been serving the site in real-time since January 25, 2017. Since its inception, sellers with a lower price won the Buy Box 43% of the time while 57% of the time sellers with a higher price won the Buy Box. The lower price wins was due to faster delivery times and higher seller ratings 25.9% of the time; whereas the higher price wins was primarily due to the same 40.6% of the time.
Table 6 – Analysis of and Reasons for Wins
| Wins | Reasons for Winning | Percent |
| Sellers with the lower price won the buy-box 43% of the time | Minimum delivery time and maximum seller rating | 25.9% |
| Minimum delivery time but lower seller rating | 11.6% | |
| Maximum seller rating but higher delivery time | 3.3% | |
| Maximum seller performance but higher delivery time and lower seller rating | 2.2% | |
| Higher delivery time, lower seller rating and lower seller performance | 0.0% | |
| Sellers with the higher price won the buy-box 57% of the time | Minimum delivery time and maximum seller rating | 40.6% |
| Minimum delivery time but lower seller rating | 13.1% | |
| Maximum seller rating but higher delivery time | 2.4% | |
| Maximum seller performance but higher delivery time and lower seller rating | 0.9% | |
| Higher delivery time, lower seller rating and lower seller performance | 0.0% |
6. Additional Features and Next Steps
The models are updated weekly in an open-source (Hadoop) batch environment, whereas the scoring is happening in real-time on the site. Based on the success of the application thus far, the following additional features are planned for the next release: (1) rank sellers based on expected revenue(/profit), which is the product of purchase incidence probability and predicted revenue(/profit); also use the total price of ownership inclusive of the shipping and handling fees; (2) develop separate Buy Box models by price range and/or by price sensitivity within a category; (3) build and test a personalized, customer-level Buy Box ranking that considers not only the attributes of the sellers (conditional logit) but also the attributes of the buyers (multinomial logit); (4) build a Buy Box simulator to be used by the sellers as a pricing aid, based on confidence intervals around historical Buy Box prices and positions; (5) to control for possible selection bias and consider the different purchase modes offered on site, model Buy Box in two stages (add-to-cart followed by conversion) instead of the current, single-stage conversion model.
7. Conclusion
Based on our literature review, our work is the first of its kind in applying a discrete choice model from econometrics to stack rank sellers on an e-commerce product detail page based on buyer preference and the attributes of the sellers. We used the conditional logit algorithm to learn the feature weights at a product category level.
Ranking sellers price-first is not optimal and leads to price wars, eroding margins, shrinking selection, and even leading to customer attrition. Even the most complex scorecard models, such as those deployed at Amazon, can get exploited by algorithmic sellers. Our approach, by putting the buyers first and frequently updating the models to control for the changing buyer needs/wants/tastes, also safeguards against algorithmic sellers. Even if/when the algorithm gets deciphered, new models are developed weekly, avoiding detection. The algorithm can easily be adapted to incorporate other business criteria such as revenue or profitability, again safeguarding against exploiters.
Having a clear strategy to manage the Buy Box is critical for the survival and success of an online marketplace business. Double digit growth in key performance indicators can be had with a model-based approach. Focusing on the buyer and tuning the Buy Box accordingly keeps buyers happy and ensures their retention. The sellers naturally follow suit. Thus, letting the buyers “own” the exact formula of the Buy Box, and not the sellers, can guarantee this outcome.
References
- D. K. Taft. Amazon buy box: The internet’s $80 billion sales button. eWeek. October 2014. http://www.eweek.com/enterprise-apps/slideshows/ amazon-buy-box-the-internets-80-billion-sales-button.html.
- L. Chen, A. Mislove, and C. Wilson. 2015. An Empirical Analysis of Algorithmic Pricing on Amazon Marketplace. http://www.ccs.neu.edu/home/amislove/publications/Amazon-WWW.pdf.
- Department of Justice, Online Marketplace Prosecution. April 2015.
- http://www.justice.gov/opa/pr/former-e-commerceexecutive-charged-price-fixing-antitrust-divisions-firstonline-marketplace.
- Douglas A. Schroeder. 2010. Accounting and Causal Effects: Econometric Challenges. Pages 77-95. http://dx.doi.org/10.1007/978-1-4419-7225-5_5.
- Shelley Farrar, Mandy Ryan, Donald Ross, and Anne FLudbrook. 2000. Using discrete choice modelling in priority setting: an application to clinical service developments. Volume 50, Issue 1, January 2000. Pages 63-75. ISSN 0277-9536. http://dx.doi.org/10.1016/S0277-9536(99)00268-3.
- M. Ryan, K. Gerard, and M. Amaya-Amaya. 2008. Using Discrete Choice Experiments to Value Health and Health Care. http://www.ccs.neu.edu/home/amislove/publications/Amazon-WWW.pdf.
- P. Bahl, R. Chancre, and J. Dungeon. 1981. Applied Discrete Choice Modelling.
- David A. Hensher. 1982. Functional measurement, individual preference and discrete-choice modelling: Theory and application. Journal of Economic Psychology. Volume 2. Issue 4. Pages 323-335. ISSN 0167-4870. http://dx.doi.org/10.1016/0167-4870(82)90035-6. http://www.sciencedirect.com/science/article/pii/0167487082900356
D. K. Taft. Amazon buy box: The internet’s $80 billion sales button. eWeek. October 2014. http://www.eweek.com/enterprise-apps/slideshows/ amazon-buy-box-the-internets-80-billion-sales-button.html.
Leave a Reply