How a data‑driven decisioning workflow transformed 30,000 raw YouTube videos into a refined shortlist of 70 high‑impact influencers
🎣 A single viral video has the power to transform a brand’s visibility from obscurity to mainstream prominence overnight. However, this phenomenon is not a random occurrence, as many brand marketers believe.
At datAcxion, we have developed a precise, reproducible process that moves beyond vague pros/cons lists and black-box AI hype. We utilize straightforward data ingestion, feature engineering, dimensionality reduction, and machine learning to periodically score and assess influencer potential.
TL;DR
We ingested over 8,000 columns of data from over 30,000 YouTube videos for an industry vertical. We cleaned and enriched this data with over 70 metrics, reducing the feature space to five interpretable dimensions. We subsequently built “reliability” and “favorability” scores at the influencer channel level, delivering a ranked list of 70 influencers (down from 5,300) that significantly outperformed our client’s legacy house list.
It might sound cliché but influencer marketing can be incredibly effective when executed correctly, in a way that traditional marketing channels may not achieve at the same speed and scale.
The challenge is identifying the right influencers – whether macro, micro, or nano – for your specific brand, objectives, and budget. Our data-driven approach helps you navigate this complex landscape. We will detail how we methodically navigate this vast, ever-changing landscape, addressing the limitations of existing tools which are often fragmented, reactive, outdated, prone to fraud, and fail to connect influencer efforts to tangible business outcomes.
Objectives
We recently worked with a client to enhance their social media marketing for a new product launch in the U.S. Traditionally, they relied on an in-house list of two dozen influencers. The objectives were to:
- Benchmark their existing influencer list against a broader range of influencers in their vertical.
- Develop a method for comparing and ranking influencers.
- Identify a shortlist of influencers and brand partners for future collaborations.
Given our client’s focus on in-depth video reviews rather than short-form content, we focused on YouTube and two other niche platforms relevant to their industry.
Data Ingestion, Filtering and Generative AI
Using the YouTube API, we searched the YouTube video library with keywords related to the product launch. This yielded approximately 30,000 videos from over 5,300 unique channels. We initially filtered these down to about 2,000 channels based on subscriber count and lifetime videos, then further refined the list to about 1,300 channels based on the number and timing of video releases in the past 12 months.
Finally, we utilized generative AI and LLMs to remove irrelevant channels (such as related toy or video game reviews), channels publishing only short-form content, and non-U.S./non-English channels.
We also used LLMs to analyze over 700,000 viewer comments to generate sentiment (positive, negative, neutral, mixed) and to identify flags such as spam, toxic, irrelevant, questions, impressed, skeptical, and funny comments.
The refined list of influencers, comprising 792 channels, was shared with the client.
Data Engineering and Machine Learning
In total, we have extracted over 8,000 columns of data per channel. From this data, we engineered over 70 metrics/features per channel, including:
- Engagement rates.
- Views, likes, and shares.
- Comments, comment likes, and sentiment per comment.
- Video release velocities and growth over time.
- Time-/recency based features and video/channel tenure.
- Virality potential. Reliability or fraud potential. An authority scorecard, which we call the favorability score.
We used dimensionality reduction to reduce the metric space to five dimensions. These were then used in a machine learning model to predict favorability (see below). The model is used for periodic re-ranking of influencers following data refreshes and to assess how new influencers compare against established norms.
| Dimensions | Description | Metric Importance | Favorability Impact |
| I | Engagement, likes, views, subscribers | 29% | 0.17 |
| II | Comments related | 23% | 0.63 |
| III | Video growth, tenure, time-based features | 19% | 0.04 |
| IV | Counts of video, views, like events | 17% | -0.08 |
| V | Subscriber summaries,virality, (+) sentiment | 13% | 0.08 |
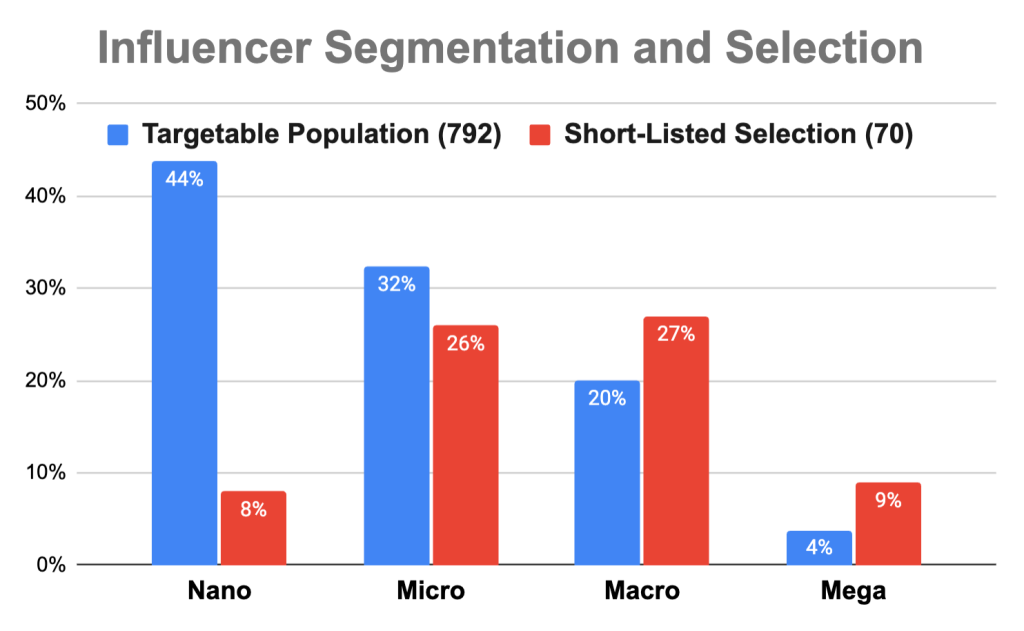
Influencer Segmentation and Selection
We’ve further ranked the 792 targetable channels to identify a shortlist for the upcoming campaigns. Our anomaly detection algorithm flagged 56 influencers (7%) as outliers.
From the remaining channels, we developed a shortlist of 70 influencers: 45 as top recommendations and 25 as secondary reserves. The shortlist prioritizes reliability and favorability, and ensures selections are among the top performers in terms of engagement, select lifetime metrics, and overall positive sentiment in user comments. The selection aligned with our client’s need to send out two batches of 25 products for in-depth video reviews across two different campaigns.
The influencer segment distributions are depicted below. Nano-influencers (less than 10K subscribers) represent 44% of the total population but only 8% of our top selections. Another third are micro-influencers (less than 100K subscribers), with the remainder being macro (less than 1M subscribers) and mega influencers (1M+ subscribers).
A diverse influencer portfolio can be highly effective, as nano and micro-influencers offer niche authority and highly engaged audiences, while macro and mega-influencers provide broad reach and mass brand awareness.
The House List, Testing and Measurement
A key objective was to benchmark our client’s existing influencer list against the broader industry. We found that only a third of their house-list of two dozen influencers appeared within the 792 channels we identified, and only one made it onto our shortlist of 70. The others were filtered out due to factors such as channel description, relevance, video recency, low behavioral counts, video format, or LLM filtering.
Our client operates in an industry with direct product ad placement restrictions. Going with the adage “you can’t manage what you can’t measure”, their campaign measurement focus will be on A/B testing specific variables. These include influencer tier (nano+micro vs. macro), video length, product integration style (demo vs. straight-talk endorsement), upload days (weekday vs. weekend), cross-platform teasers (no teaser vs. Reelz/TikTok driving traffic to YouTube), title aand description copy (keyword-rich vs. curiosity-driven, bulleted vs. paragraph), and affiliate brand placement (description only vs. description and pinned comment).
Takeaways for Marketers and Data Scientists
Winning in influencer marketing should not feel like a lottery: Don’t rely on gut feel or legacy lists, missing high-potential creators. Fraud, fake followers, and vague attribution plague the industry. The following reflects on our lessons learned:
- Influencer quality is multi-dimensional: Rely on a composite score (engagement + sentiment + growth) rather than on follower count or views alone.
- Transparency wins internal buy‑in: Ability to explain a score as to why/ how a nano influencer ranks higher than a macro influencer is key to win over brand teams.
- Diversity of tier beats “all‑macro/mega”: A mixed portfolio balances reach, cost, and audience authenticity.
- Raw data is noisy: Extensive prep, cleaning and filtering using LLMs are essential to prune irrelevant and unreliable creators.
- Dimensionality reduction clarifies signal: Use PCA or embeddings (t‑SNE) to compress the feature space into a handful of interpretable axes.
If you’re curious how a data‑first influencer pipeline could look for your brand – whether you’re in beauty, fashion, retail or fintech – drop a comment below or reach out directly at [email protected] We are happy to share a demo, discuss ideas, or explore partnership opportunities. We have developed solutions for 20% of categories that cover 80% of economic activity, including: beauty & cosmetics, apparel & fashion, health & fitness, food & beverage, travel & hospitality, consumer tech & gadgets, financial services & fintech and automotive.
Leave a Reply